Collecting customer feedback during development is critical. Analyzing the feedback effectively is equally important. With Stomio, moving from top level metrics to deep analysis is easy and simple
In this article
Collecting customer feedback during development is critical. Analyzing the feedback effectively is equally important. With Stomio, moving from top level metrics to deep analysis is easy and simple
In this article
As a Manager, navigate to your beta → Results. You will see the results page with 4 tabs on top: Your pins, General Insights, Feedback, Tickets Summary, and Testers.
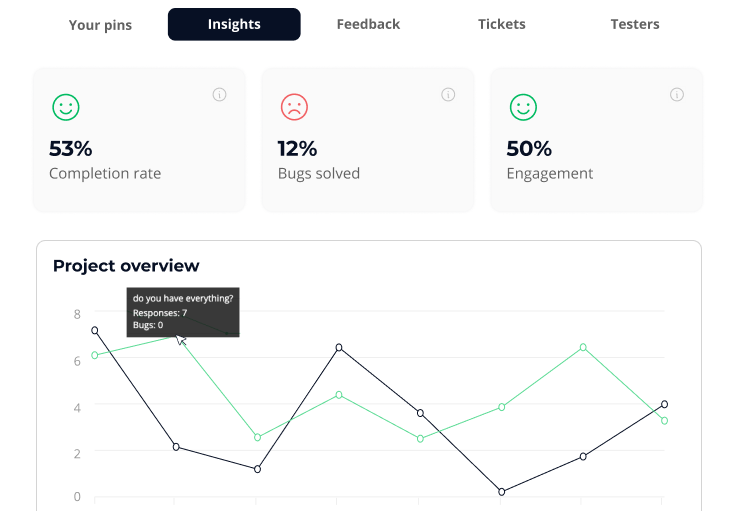
In the General Insights tab, you will see high-level data about your program. At the top, you will see the top 3 metrics we track for your program: Completion Rate, Bugs Solved, and Engagement.
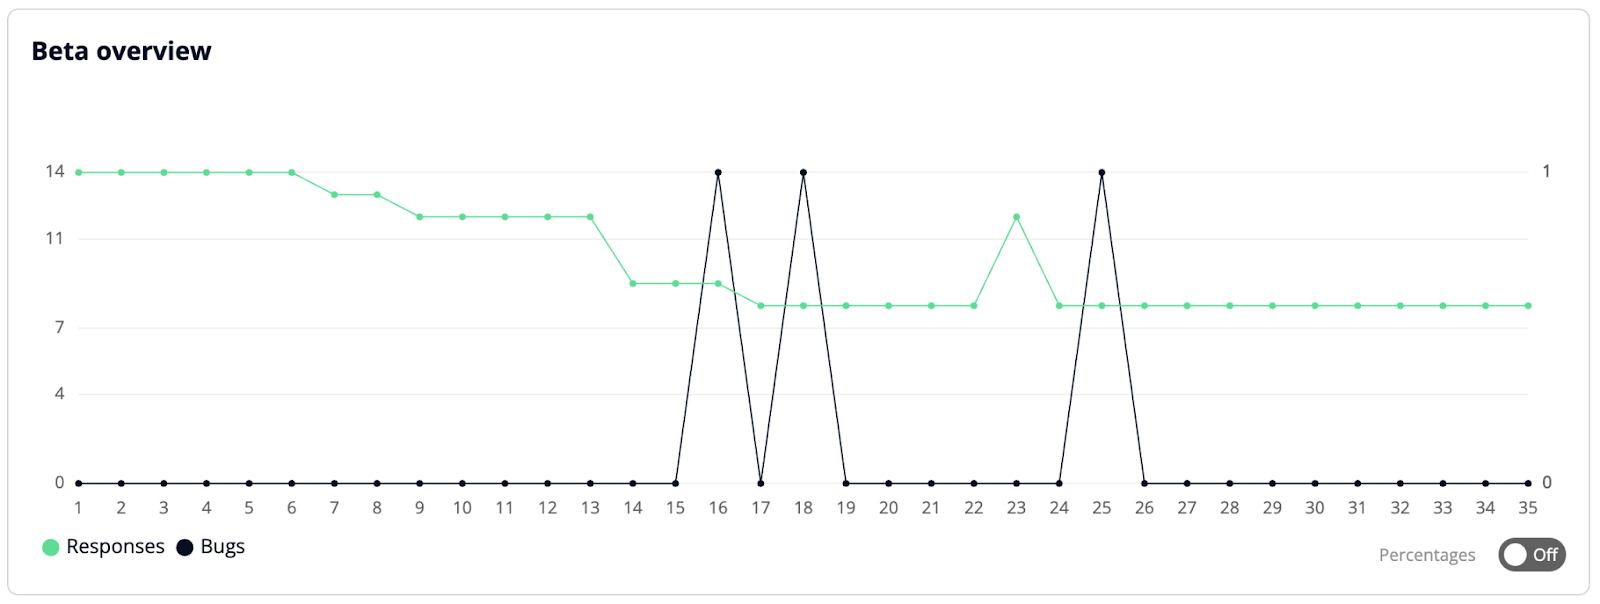
Below the top metrics, you see the Beta Overview chart. In the chart, you’ll be able to see the number of responses and bugs reported per step you created in the flow. You can hover over any data point to see more information about that step. You can also switch the chart to percentages instead of number of responses by clicking on the toggle on the bottom right.
Next is the Tester Activity block where you can see all tester activity that happened in the past 24hrs. This includes the number of tasks completed, number of tickets opened, and number of new testers signed up for the beta.

If you want to dig deeper into the tester activity log, click on “See activity log” so you can see a lot more data and you can change the timeline of the report among other things.
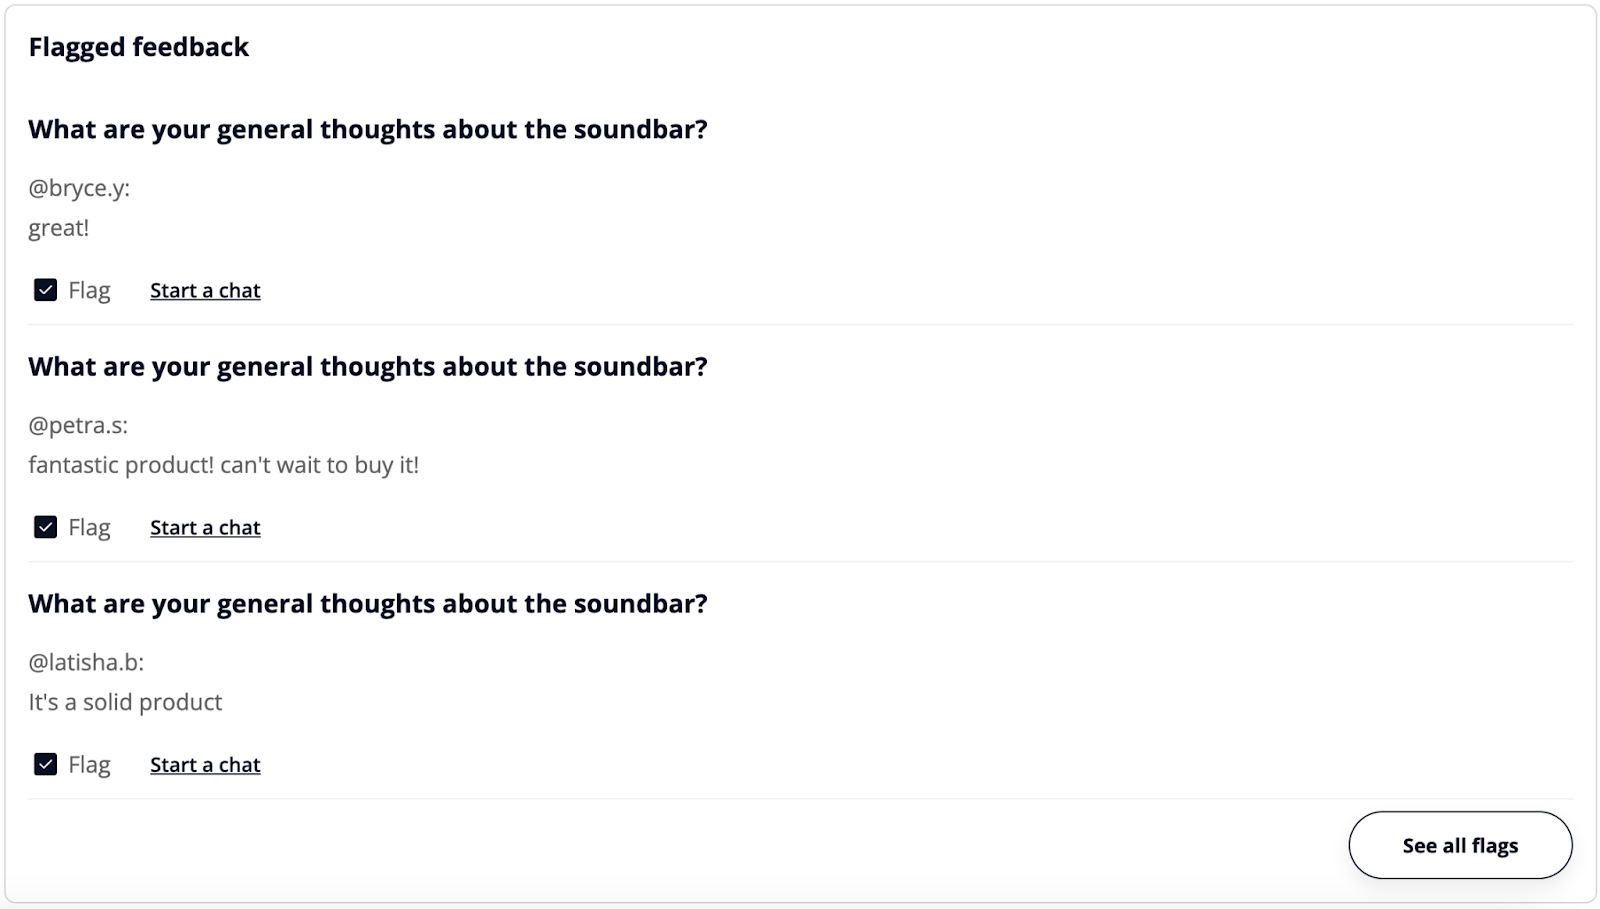
Next is your Flagged Feedback block. As you read through raw feedback in your flow, you might want to flag a specific feedback so it’s surfaced to the top. This could be for following up or to pass this feedback to other group members in your team (e.g. great quote to be used in product marketing). The table shows top 5 flagged feedback, click on “See all flags”
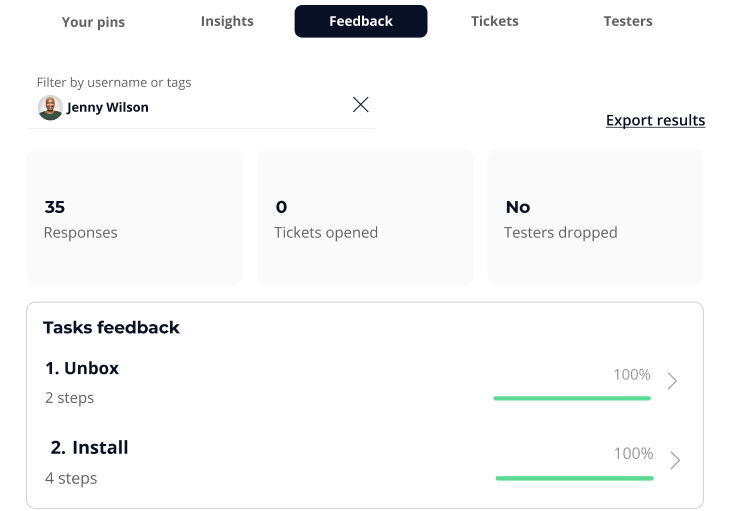
You can start digging into your tester feedback by clicking on the Feedback tab. This brings you to the feedback view where you see top level metrics: Responses, Tickets Opened, and Testers Dropped.
Then you’ll see your flow on a task level with number of steps, number of users who completed each step, and the step completion rate in one view.
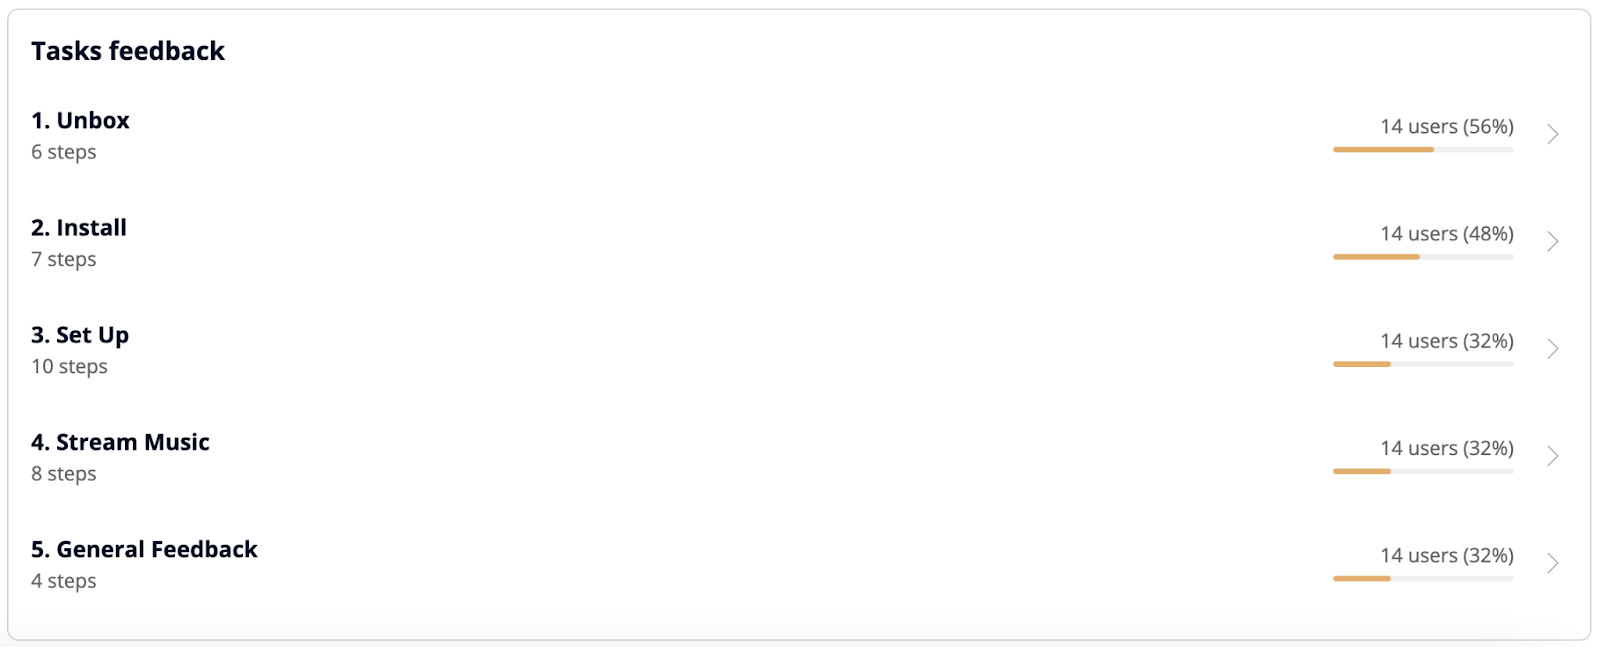
You can filter this table by a specific user to see their journey, multiple users, or a tag. Simply click on the filter field and select how you want to filter the view
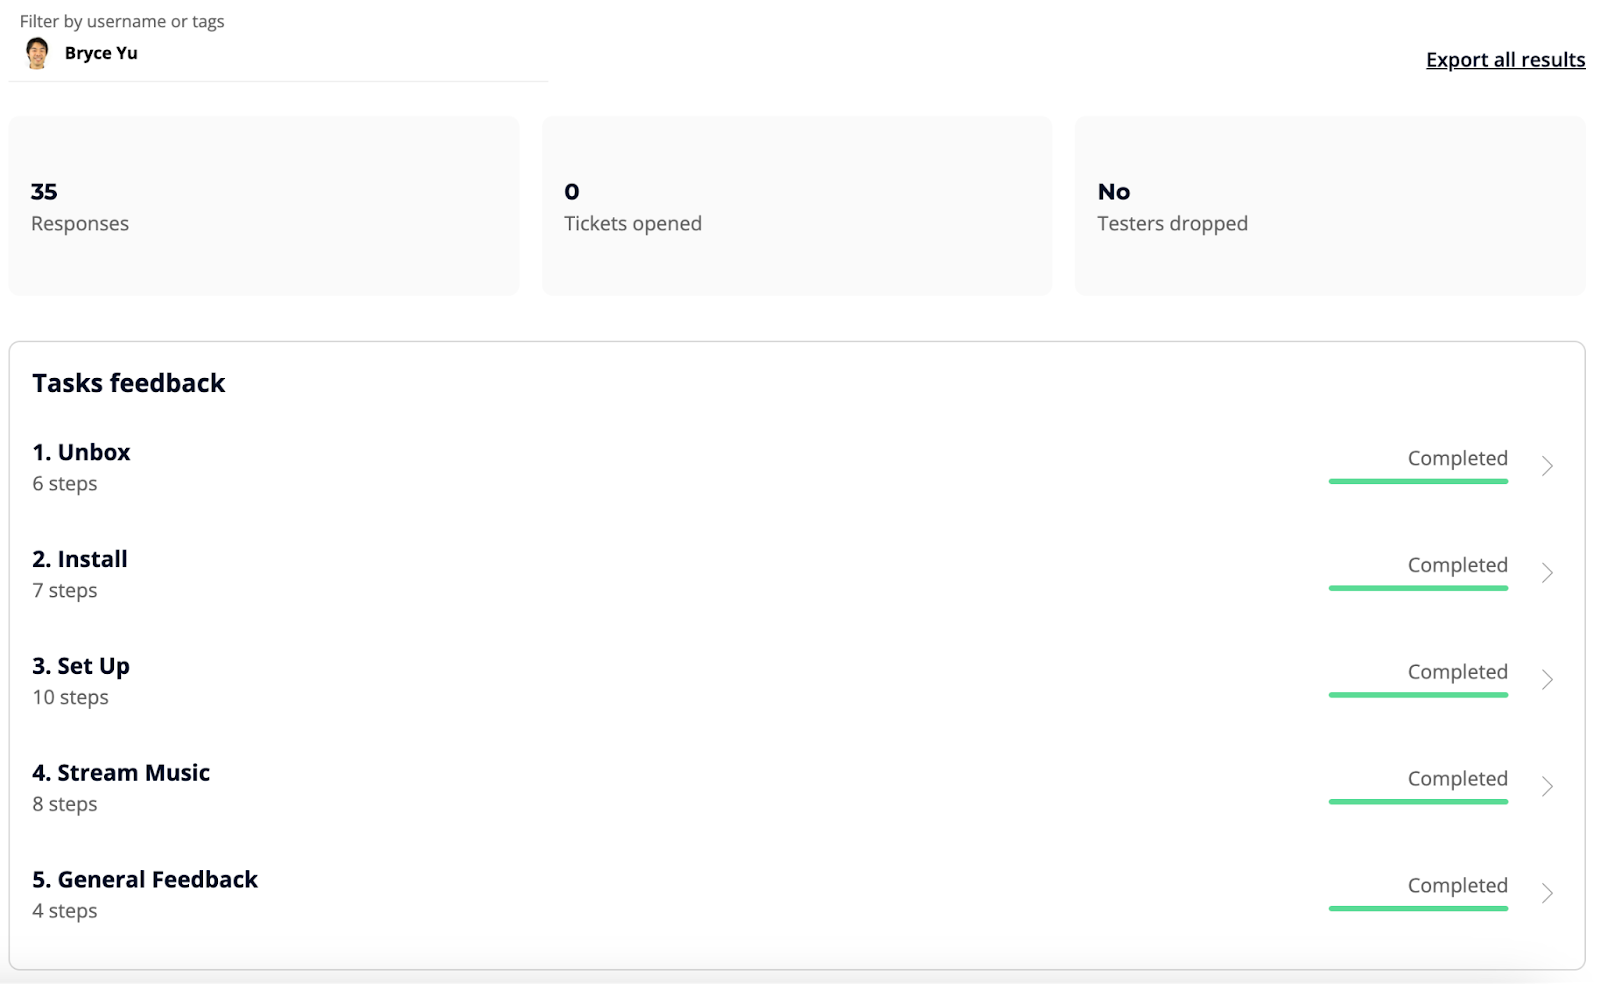
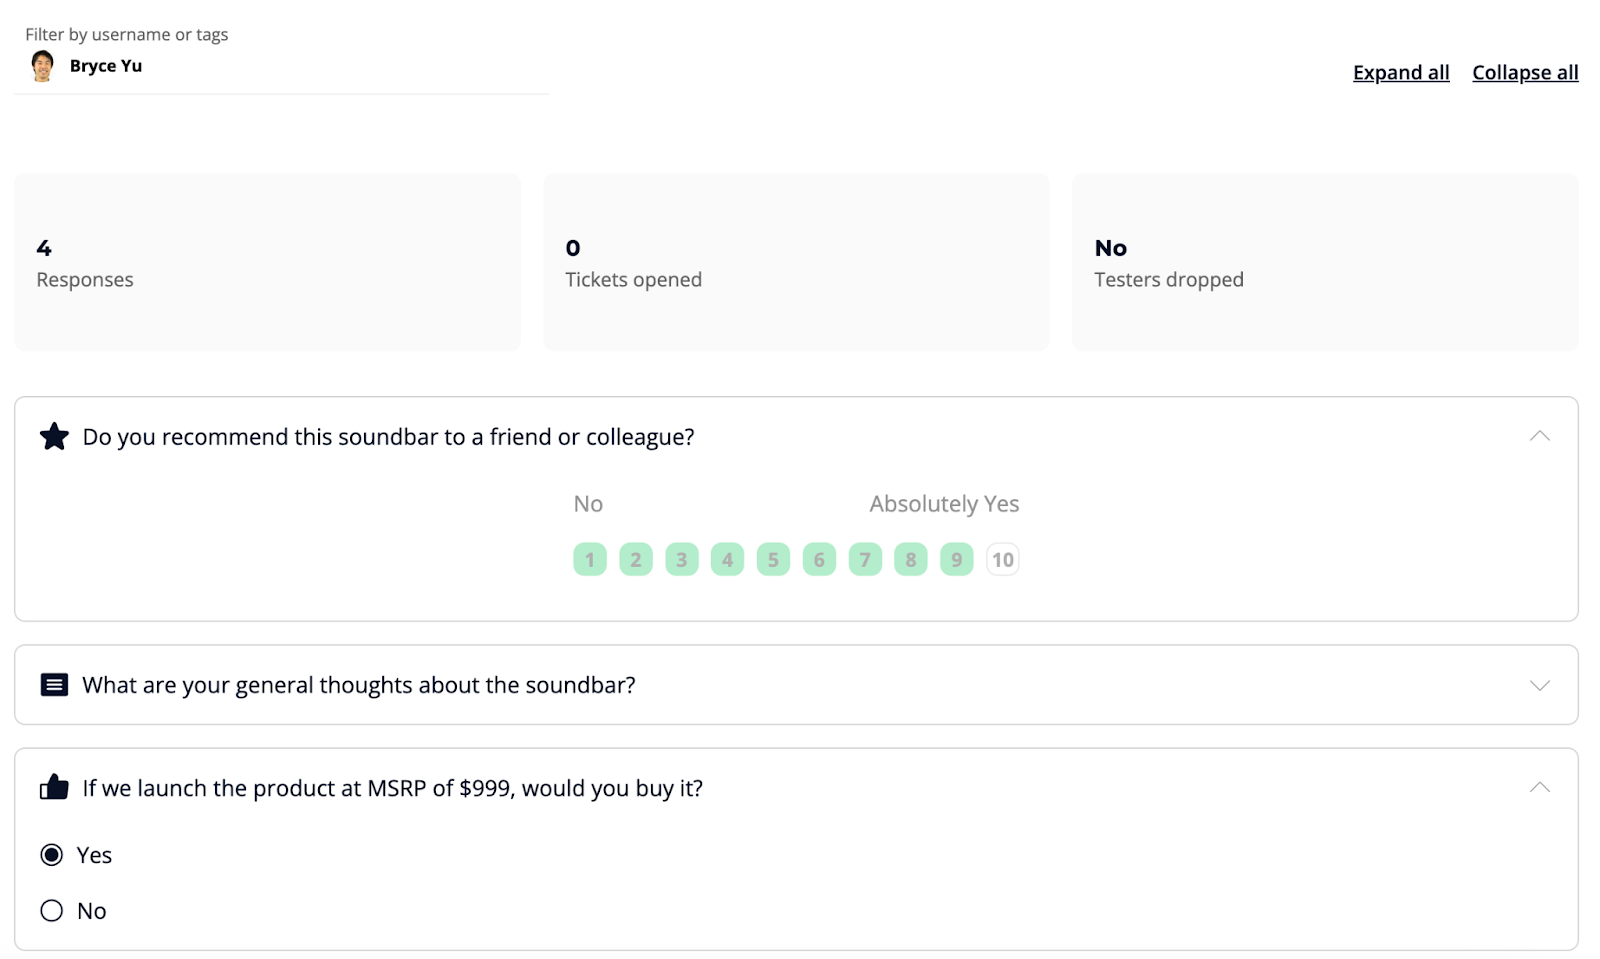
Diving into a specific task is as simple as clicking on that task and you’ll be directed to the steps view of that task. The same top metrics are now representing that specific task. You can expand a specific step by clicking on it. Or you can expand all steps by clicking on “Expand All”
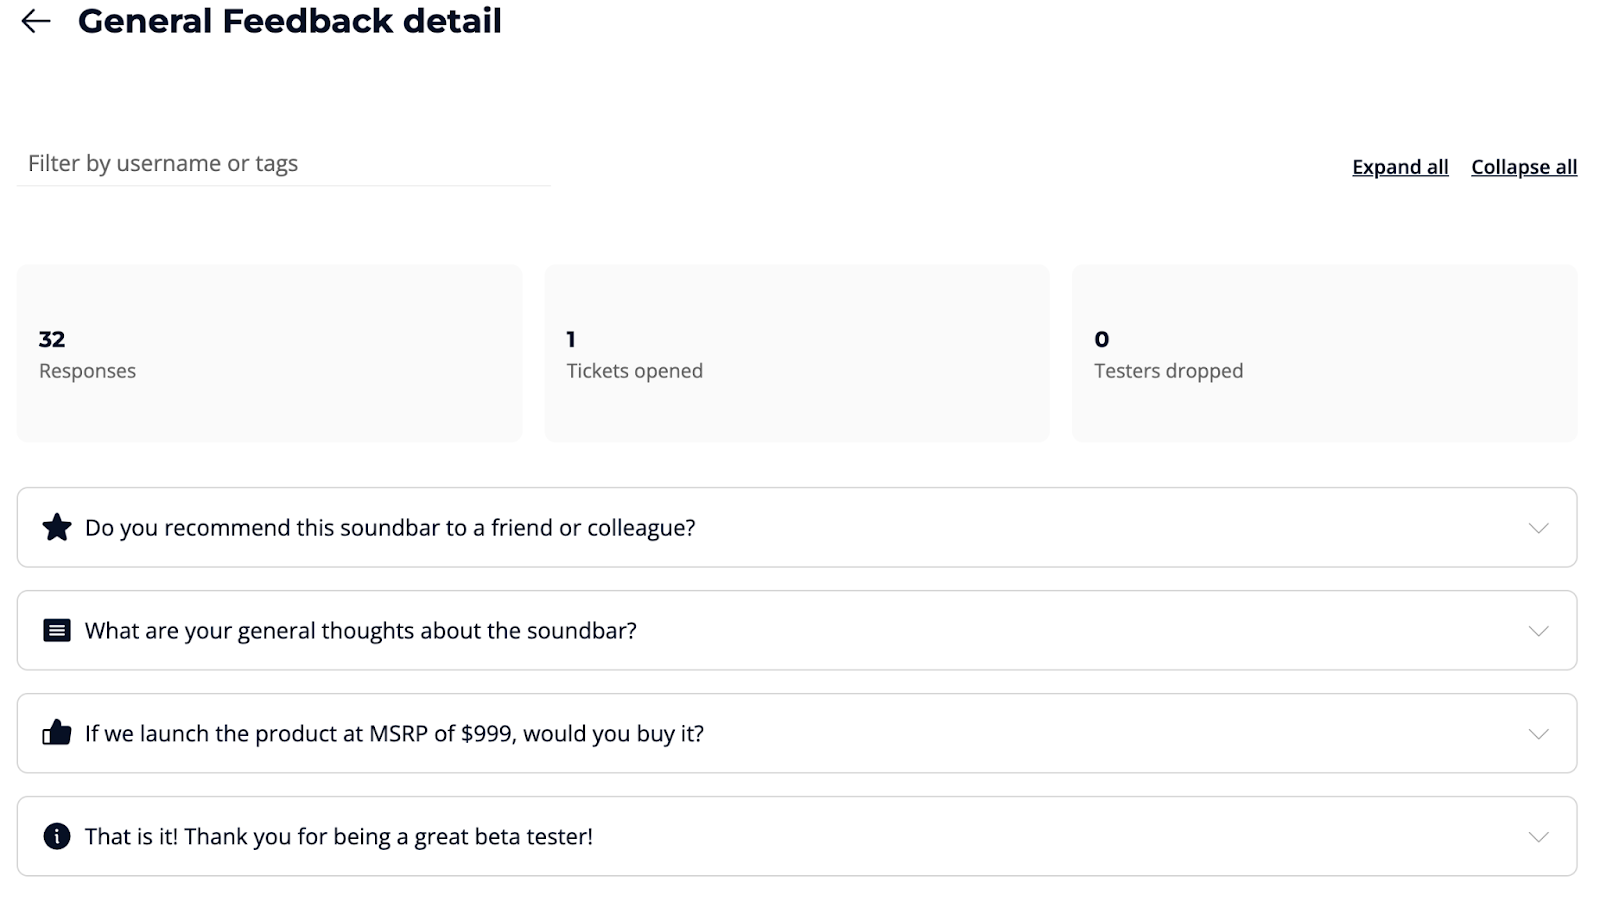
If the step is a feedback step, you can see high level aggregated data about that step.
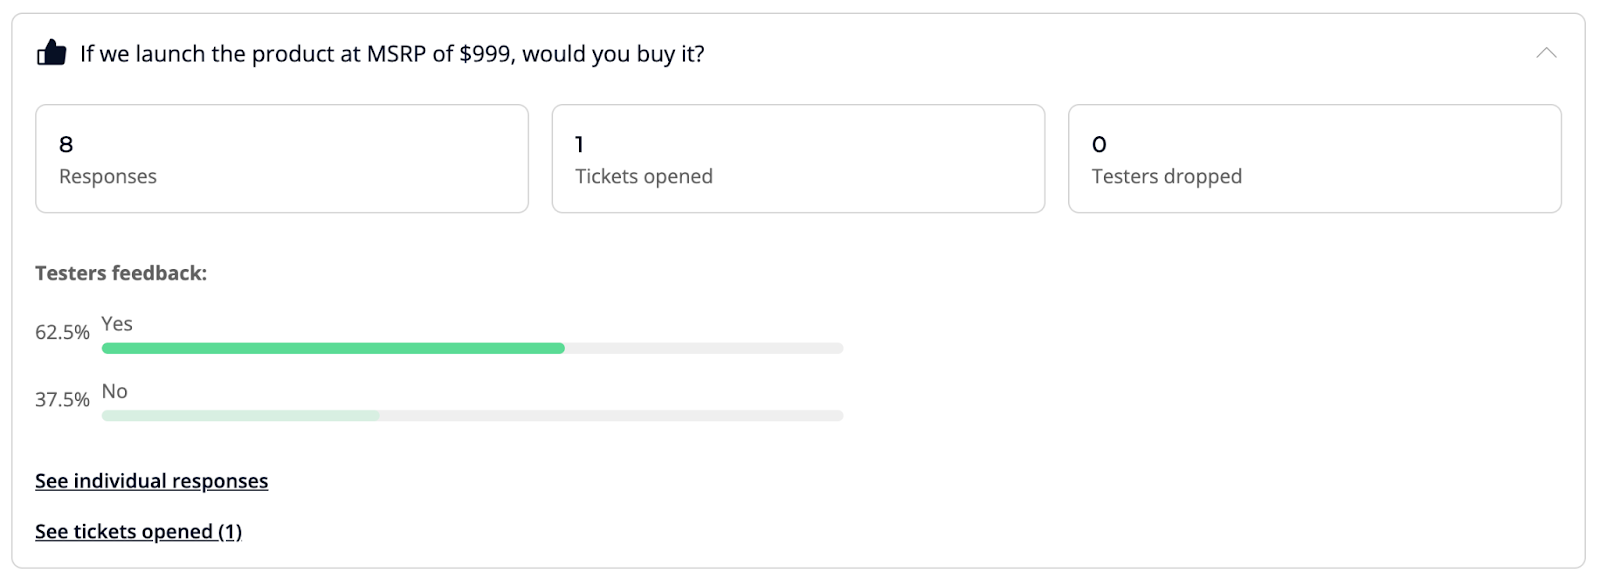
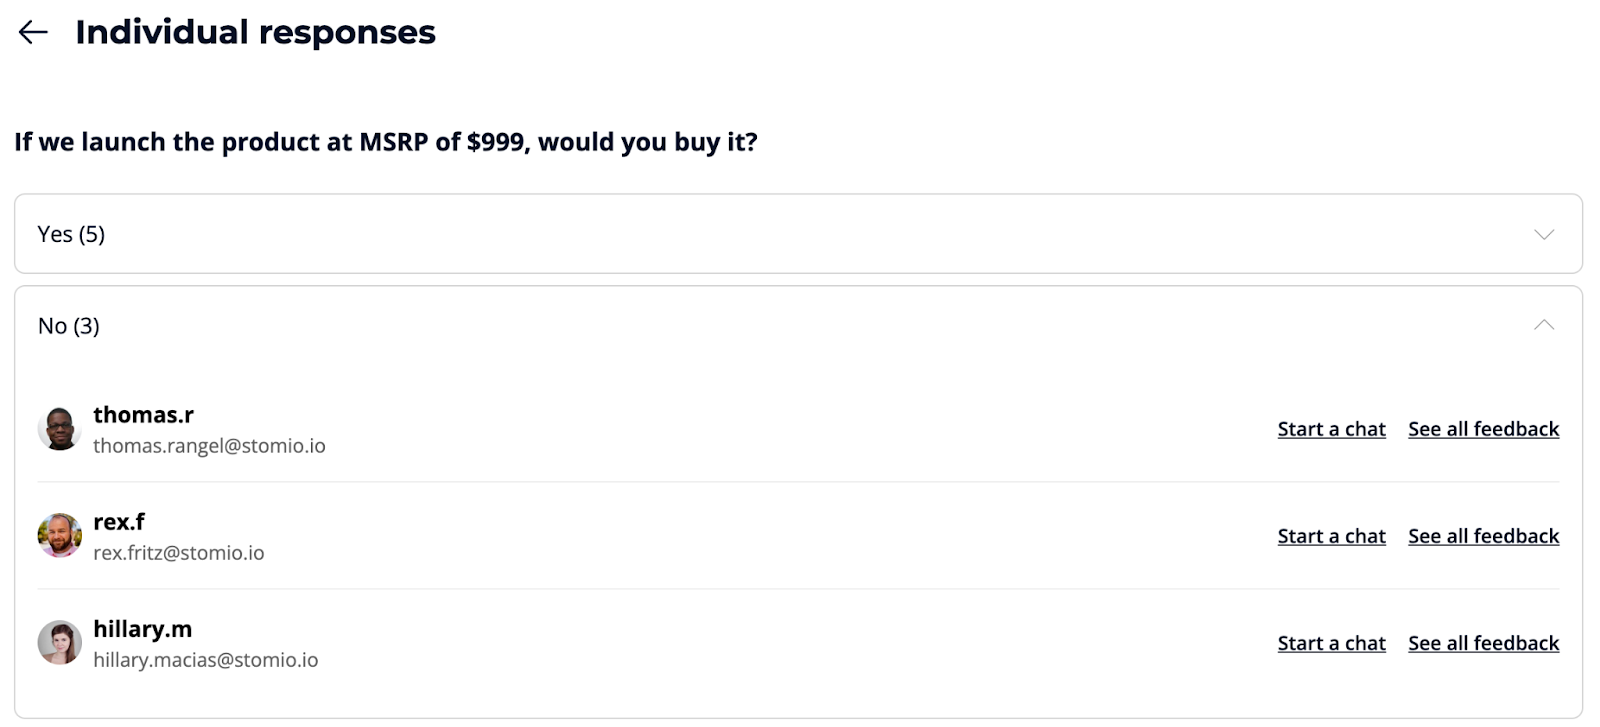
You can also see individual responses by clicking on “See individual responses” which takes you to a different screen where you can see those responses.
You can also filter the task view by a specific tester or a tag so you can see what that tester responded in their flow to bring more context to their feedback.
Got a question or suggestion? Reach out to us: hello@stomio.io

Stomio has earned its reputation as a leading platform for gathering user feedback across...
